How to Track Crypto Funding Fees Across Multiple Exchanges
Track settled crypto funding payments across multiple exchanges, separate paid and received amounts, and include net funding in position-level PnL calculations.
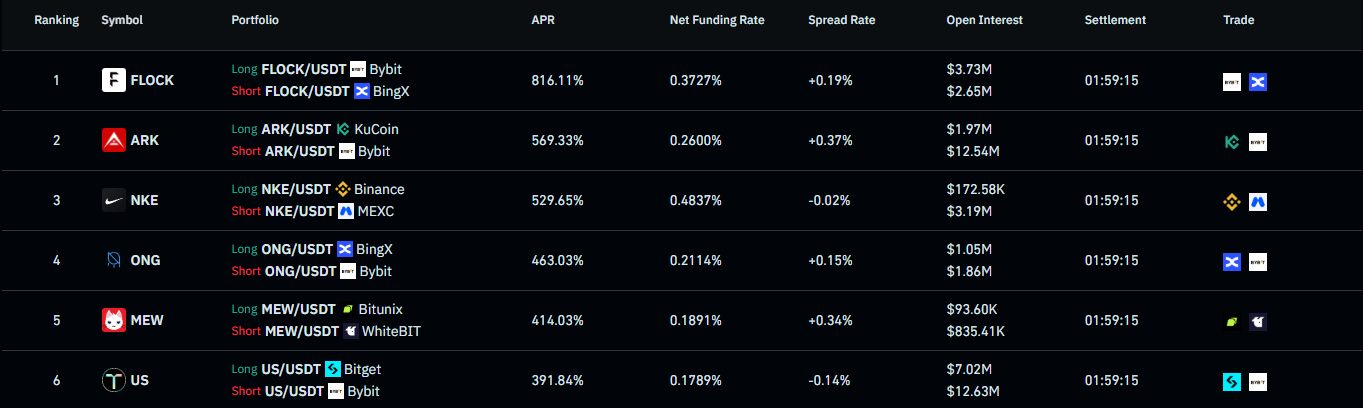
A perpetual position can be profitable on price and still lose money after funding. The effect is easy to miss when positions are split across exchanges, especially when one venue pays funding while another charges it on the hedge.
A crypto funding fee tracker should record the payments that actually settled, not just the rate currently shown beside the contract. It should also connect each payment to the correct account, position, and side of the trade.
That is harder than copying a few percentages into a spreadsheet.
What funding payments measure
Perpetual futures do not have an expiry date. Funding payments help keep the contract price close to the underlying spot market by transferring value between long and short position holders.
When the funding rate is positive, longs generally pay shorts. When it is negative, shorts generally pay longs. The exchange does not usually keep the funding payment as a trading fee; it passes value between participants according to the venue's rules.
A simplified payment can be written as:
Funding payment = position notional × funding rate
If a trader holds 200,000 USDT of notional exposure and the settled rate is 0.01%, the payment is 20 USDT before any venue-specific adjustments. The direction depends on the position side and the sign of the rate.
The calculation looks simple. Tracking it across accounts is not.
Why funding data becomes fragmented
A trader might hold a long perpetual on Binance, hedge it with a short on Bybit, keep another position on OKX, and use Hyperliquid when its rate or liquidity is more attractive.
Each venue reports its own funding rate and payment history. The screens may look similar, but the underlying records are not standardized.
Funding intervals can differ by contract and may change during volatile markets. One interface may show the next estimated rate, while another places the last settled payment in account history. Rates may be displayed per interval, per hour, or as an annualized figure. Settlement assets can also differ.
The sign can be confusing. A positive number may describe the market rate, not a positive cash flow for the account. A long position facing positive funding will normally pay. A short position facing the same rate will normally receive.
Position changes add another layer. If the trader reduces a position shortly before settlement, the payment may reflect a different notional than the current position screen shows later. Looking at today's size does not reconstruct yesterday's funding.
Estimated rates are not settled payments
The rate displayed before the funding timestamp is useful for planning. It is not an accounting record.
Estimated rates can change before settlement. A position may close early, resize, or move to another venue. The final payment may also use a venue-specific notional or reference price. Recording the estimate as if it had settled creates phantom income or expense.
A funding tracker needs two separate datasets:
upcoming or predicted rates used to evaluate the trade;
completed payments used to calculate actual PnL.
Mixing them produces a chart that looks current but cannot be reconciled against account equity.
For performance reporting, the settled payment wins.
How funding changes the result of a hedge
Funding is often discussed as if it belongs to one perpetual position. Multi-venue strategies need a portfolio view.
Consider a delta-neutral trade with a long perpetual on one venue and a short perpetual on another. The long pays 80 USDT during one funding window. The short receives 55 USDT. The net funding cost is 25 USDT.
Reporting only the payment received on the short side makes the trade look better than it was. Reporting only the long account overstates the cost. Both legs belong to the same strategy.
This matters even more over time. A modest net payment repeated several times per day can consume a large part of the expected spread. The entry basis may still look attractive while the carry has turned against the trade.
Funding therefore belongs in position-level PnL, not in a detached transaction table that nobody reviews until the end of the month.
Tracking funding in a spreadsheet
A basic spreadsheet can work when there are only a few positions. Use one row per settled payment and record:
venue and account;
contract;
long or short side;
settlement timestamp;
position notional;
settled rate;
amount paid or received;
settlement asset;
strategy or paired-position ID.
The last field matters. It lets the trader combine the payments from both sides of a hedge rather than reviewing each account in isolation.
A useful convention is to store received funding as positive and paid funding as negative. Do not rely on the exchange's raw sign until its meaning has been checked. Different API fields and exports may represent direction differently.
The spreadsheet should also keep the original amount and a converted reporting value. If a contract settles funding in BTC, converting it to USDT at the settlement timestamp preserves the historical value. Revaluing the old BTC payment at today's price mixes funding performance with BTC price exposure.
The manual approach becomes difficult once the portfolio has many contracts, subaccounts, and frequent settlements. Missing one export or copying one estimated rate instead of the final payment can distort the result.
How to track funding payments in crypto through APIs
Read-only exchange APIs can retrieve funding history without exposing trading or withdrawal access. They remove most copy-and-paste work, but the records still need normalization.
A multi-exchange system has to standardize contract names, timestamps, payment signs, settlement currencies, and account identifiers. It also needs to deduplicate results when API queries overlap. Without that step, the same funding payment can be counted twice.
Historical limits matter. Some endpoints return only a fixed time window or number of records. A tracker that stores each payment after retrieval is less likely to develop gaps than one that tries to rebuild years of history on demand.
API syncs can fail as well. Rate limits, expired credentials, exchange maintenance, or a temporary network error may leave one account behind the others. A stale account should be marked clearly rather than included in the current total without warning.
What a crypto funding fee tracker should show
The headline number is net funding across all connected venues. It should be possible to filter that figure by date, exchange, account, asset, contract, and strategy.
Gross amounts are useful too. A portfolio that paid 30,000 USDT and received 29,500 USDT has a net cost of only 500 USDT, but the gross flows show that the strategy depends on two large and offsetting legs. If one leg disappears, the economics change quickly.
The tracker should provide:
paid, received, and net funding;
payment history at the settlement-event level;
current and historical rates without mixing estimates with settlements;
funding attached to each open or closed position;
combined funding for paired long and short legs;
reporting-currency conversion using the relevant timestamp;
warnings when an account is stale or a leg becomes unhedged.
A daily total alone is not enough. Traders need to trace it back to the specific payment and position.
What a perpetual funding tracker can tell you
Once the data is normalized, funding history becomes useful for more than bookkeeping.
It shows whether a strategy earns what its entry spread suggested. It reveals which venue tends to carry the expensive leg. It can also identify positions that have stayed open longer than planned and are now leaking carry.
The history can answer practical questions:
How much funding did this hedge earn after both legs were included?
Which exchange produced the largest funding cost this month?
Did the rate reverse after the position was opened?
Is the current spread large enough to recover the funding already paid?
Would closing or moving one leg reduce carry without adding too much execution risk?
These are monitoring questions, not trading signals. A tracker explains the current and historical cost. It cannot guarantee where the next funding rate will settle.
Tracking funding across venues with ArbLens
ArbLens consolidates supported CEX accounts, perpetual DEXs, and on-chain wallets in one dashboard. Funding payments sit alongside balances, positions, PnL, fills, and transfer history rather than in a separate exchange tab.
For cross-venue arbitrage and hedged positions, ArbLens can show the long and short legs together. Funding, fees, and position PnL can then be reviewed at the trade level while the original venue data remains available for inspection.
The dashboard also tracks liquidation distance and flags unhedged exposure when one side closes or partially fills. That context matters because a favorable funding payment does not compensate for an unmanaged directional position.
Connections use read-only API keys. ArbLens does not require trading or withdrawal permissions, does not execute trades, and does not predict funding rates. Its job is to make the funding already paid or received easier to monitor across supported venues.
A practical funding reconciliation routine
When connecting a new account, compare several recent funding events with the exchange's native history. Check the contract, timestamp, rate, amount, settlement asset, and payment direction.
Then verify one paired trade manually. Add the payments from both legs and compare the result with the dashboard's net funding for that position. If the numbers differ, check timezone boundaries, currency conversion, and whether one venue labels a debit with a positive raw value.
Run the same check after changing account type, adding a subaccount, or rotating an API key. A connection can remain active while missing access to one wallet or product category.
Over time, review exceptions rather than every payment. Missing settlements, stale accounts, duplicate records, and sudden changes in gross funding deserve attention. Small differences in the displayed upcoming rate do not affect historical PnL until a payment settles.
Funding should be part of net PnL
Funding is not a side note for perpetual traders. It is part of the cost of holding the position.
To track funding payments across crypto venues, store settled events, normalize their direction and currency, and attach them to the positions that generated them. For hedged trades, combine both legs before judging whether the strategy earned or lost carry.
The current rate helps with the next decision. The payment history explains the result you already have.