How to Monitor Open Crypto Positions Across Multiple Exchanges
Monitor open crypto positions across exchanges with one view of size, side, PnL, funding, liquidation distance, sync status, and unhedged exposure in real time.
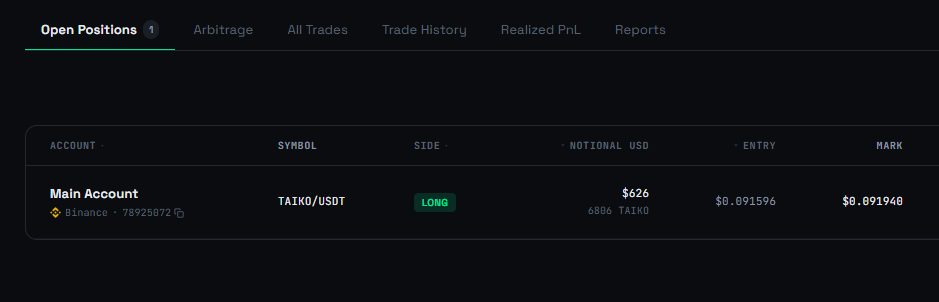
Opening positions on several venues is easy. Understanding the combined exposure is harder.
A trader may hold spot collateral on Binance, a short perpetual on Bybit, another hedge on OKX, and an on-chain position on Hyperliquid. Each venue shows its own position correctly. None knows how the positions fit together.
To track crypto positions across exchanges, you need one view of side, size, entry price, mark price, PnL, funding, margin, and liquidation risk. The view also needs to show whether supposedly hedged legs are still balanced.
A list of account balances cannot do that.
Open positions are not the same as open interest
The terms are easy to confuse.
An open position is a specific trader's active exposure: long or short, with a defined size, entry price, and margin profile. Open interest is a market-wide figure showing the value or number of derivative contracts that remain open across participants.
A portfolio tracker is concerned with the first. It needs account-level data from the exchanges and wallets the trader controls. Public market data cannot reveal private positions, subaccounts, collateral, or liquidation thresholds.
This distinction matters when choosing a tool. A market analytics platform may chart open interest perfectly while showing none of your actual exposure.
Why native position screens do not combine cleanly
Exchange dashboards are built around their own contract and account models. Even when two screens use the same labels, the fields may not mean exactly the same thing.
Position size is one example. A venue may display the quantity in BTC, the number of contracts, or USDT notional. Linear and inverse contracts settle differently. Options add another unit system. Summing the raw size column can produce nonsense.
PnL is another source of mismatch. Unrealized PnL may use mark price, while the trader is looking at the order book's last price. Fees and funding may appear separately. A position that looks profitable before carrying costs can be negative after them.
Margin data also needs context. Cross margin shares collateral across positions inside an account. Isolated margin limits collateral to a specific position. A liquidation price from one model cannot be read in the same way as a liquidation price from the other.
Account modes complicate the picture further. In one-way mode, opposing trades may reduce or reverse the same position. In hedge mode, long and short positions can remain open at the same time. A normalized dashboard has to preserve this difference rather than forcing every venue into the same shape.
The fields worth monitoring
A multi-venue position view should include enough detail to answer three questions: what is open, how is it performing, and how close is it to forced closure?
For each position, the useful fields include:
exchange and account or subaccount;
contract and settlement asset;
long or short side;
position quantity and normalized notional;
entry and mark price;
unrealized and realized PnL where available;
leverage and margin mode;
margin allocated or used;
liquidation price and liquidation distance;
accumulated funding and trading fees;
last successful sync time.
Not every venue exposes every field through the same endpoint. Missing data should remain missing or be clearly derived. Filling gaps with an unexplained zero makes the portfolio look safer than it is.
The timestamp deserves its own column. A position snapshot is useful only if the reader knows when it was last updated.
How hedged positions become unhedged
Many cross-exchange positions are linked. A trader might hold a long spot asset and short a perpetual, or run opposing perpetual positions to capture a funding or basis difference.
At entry, the legs may be balanced. They often drift later.
One order can partially fill. One venue may reduce a position during a margin event. The trader may close one side and forget the other. Contract multipliers can also create a size mismatch that is not obvious from the displayed quantities.
Suppose one venue holds a 4 BTC long while the hedge elsewhere is a 3.5 BTC short. The portfolio still has 0.5 BTC of net long exposure. Looking at two separate screens may suggest that the trade is hedged because both legs exist. The sizes show otherwise.
A position tracker should pair related legs and calculate the residual exposure. If one side closes or changes size, the pair should be flagged rather than left looking complete.
This is one of the biggest differences between a position list and an operational monitoring tool.
Why a spreadsheet stops working
A spreadsheet is often the first multi exchange position tracker. It can record the venue, symbol, side, size, and entry price for each leg.
The problem is maintenance.
Mark prices change continuously. Partial fills alter the size and average entry. Funding settles. Fees accumulate. Collateral moves between wallets. Liquidation distance changes even when the position itself has not been edited.
Manual updates also create timing mismatches. If the first account is copied at 10:00 and the fourth at 10:12, the final sheet is not a single portfolio snapshot. It is a combination of states from different moments.
The sheet becomes even less reliable when several people operate the accounts or automated systems place orders. The position can change without anyone updating the document.
Spreadsheets still work for planning, trade notes, and periodic review. They are weak at live position monitoring.
How to track crypto positions across exchanges with APIs
Read-only APIs let a tracker request current positions, balances, fills, funding payments, and account settings without permission to place or cancel orders.
Retrieval is only the first step. The data then has to be normalized.
A position service needs to map symbols, distinguish spot from linear and inverse derivatives, convert quantities into a comparable notional, and preserve the settlement currency. It must understand whether the venue uses one-way or hedge mode. It also needs a consistent sign convention so a short is not mistaken for a negative balance.
The sync process must handle temporary failures. Rate limits, maintenance, expired credentials, or a disabled permission can leave one account stale. A tracker should show that state explicitly and exclude the old data from any figure that claims to be current.
Historical snapshots add context. The live position explains what is open now. Fill history explains how it got there. Funding and fee records show what the position has cost to carry.
What a multi exchange position tracker should show
A useful dashboard needs more than a table of contracts.
At portfolio level, it should summarize gross long exposure, gross short exposure, net exposure, and total unrealized PnL. The user should be able to filter by venue, asset, account, and strategy.
At position level, every row should retain the original exchange data. Normalized notional is helpful for comparison, but the native quantity and settlement asset still matter when reconciling the number.
At strategy level, related legs should appear together. A paired view makes it possible to monitor:
size mismatch between the long and short;
combined unrealized PnL;
funding paid and received on both legs;
fees and fill history;
the smaller liquidation buffer;
a leg that is missing, stale, or only partially filled.
The dashboard should allow the trader to move from the combined result back to the account and fill that produced it. Otherwise, the total is difficult to trust.
What a crypto futures position tracker should not do
Monitoring software should not hide uncertainty.
If the API has not synced, the position should be marked as stale. If liquidation data is unavailable or cannot be compared directly, the interface should say so. If two legs were paired automatically, the trader should be able to inspect why they were matched.
The tracker should also keep monitoring separate from execution. A read-only position dashboard does not need trading or withdrawal permissions. Adding those permissions expands the damage possible if a key is exposed.
Nor should the tool pretend that a current position snapshot is complete performance accounting. Closed fills, fees, funding, deposits, and withdrawals belong in the broader record. The open-position view is one part of portfolio monitoring.
Monitoring open positions with ArbLens
ArbLens brings positions from supported CEX accounts, perpetual DEXs, and on-chain wallets into one dashboard. It keeps the venue and account visible while providing a combined portfolio view.
For hedged and arbitrage trades, long and short legs can be shown together. ArbLens tracks their size, spread, funding, PnL, and liquidation distance. If one side closes or only partially fills, the remaining leg can be flagged as unhedged exposure.
The same dashboard includes free and locked balances, fill history, funding payments, and transfers. This helps explain whether a position changed because of trading, a collateral move, or a sync problem.
Connections use read-only API keys. ArbLens does not require trading or withdrawal permissions and does not place, modify, or cancel orders. It monitors the accounts; it does not manage the trades.
A practical setup and verification process
Start with a complete account inventory. Include subaccounts, unified accounts, futures wallets, and on-chain addresses that can hold exposure. A forgotten subaccount can make the portfolio look hedged when it is not.
Create read-only API keys and enable only the permissions needed for balances, positions, fills, funding, and transfer history. Use IP restrictions where they are supported and compatible with the connection.
After connecting each account, compare the dashboard with the native venue. Check at least one long and one short position. Verify the quantity, side, entry price, margin mode, unrealized PnL, and liquidation figure.
For a paired trade, confirm that the correct legs were matched. Compare normalized notionals, not just contract quantities. Then check that a deliberate size mismatch appears as residual exposure rather than being hidden.
Review sync timestamps before relying on the aggregate. If one venue is stale, investigate the connection first. Recalculating the portfolio with old position data only creates a more polished error.
Position monitoring is exposure monitoring
The purpose of a position tracker is not to reproduce several exchange screens in one browser tab. It is to show how the positions interact.
That means normalizing size without losing native detail, pairing related legs, separating PnL from funding and fees, and making liquidation risk visible by account. It also means showing when the data is stale or the hedge is incomplete.
A trader who can see every open position but cannot see the net exposure still has only part of the picture.