How to read tokenized-equity data: spread, volume, and depth
A wide spread means little if the order book cannot fill your trade. Learn how to assess volume, depth, fees, and executable prices in tokenized-equity markets.
Part 2 of a three-part series on tokenized-equity arbitrage.
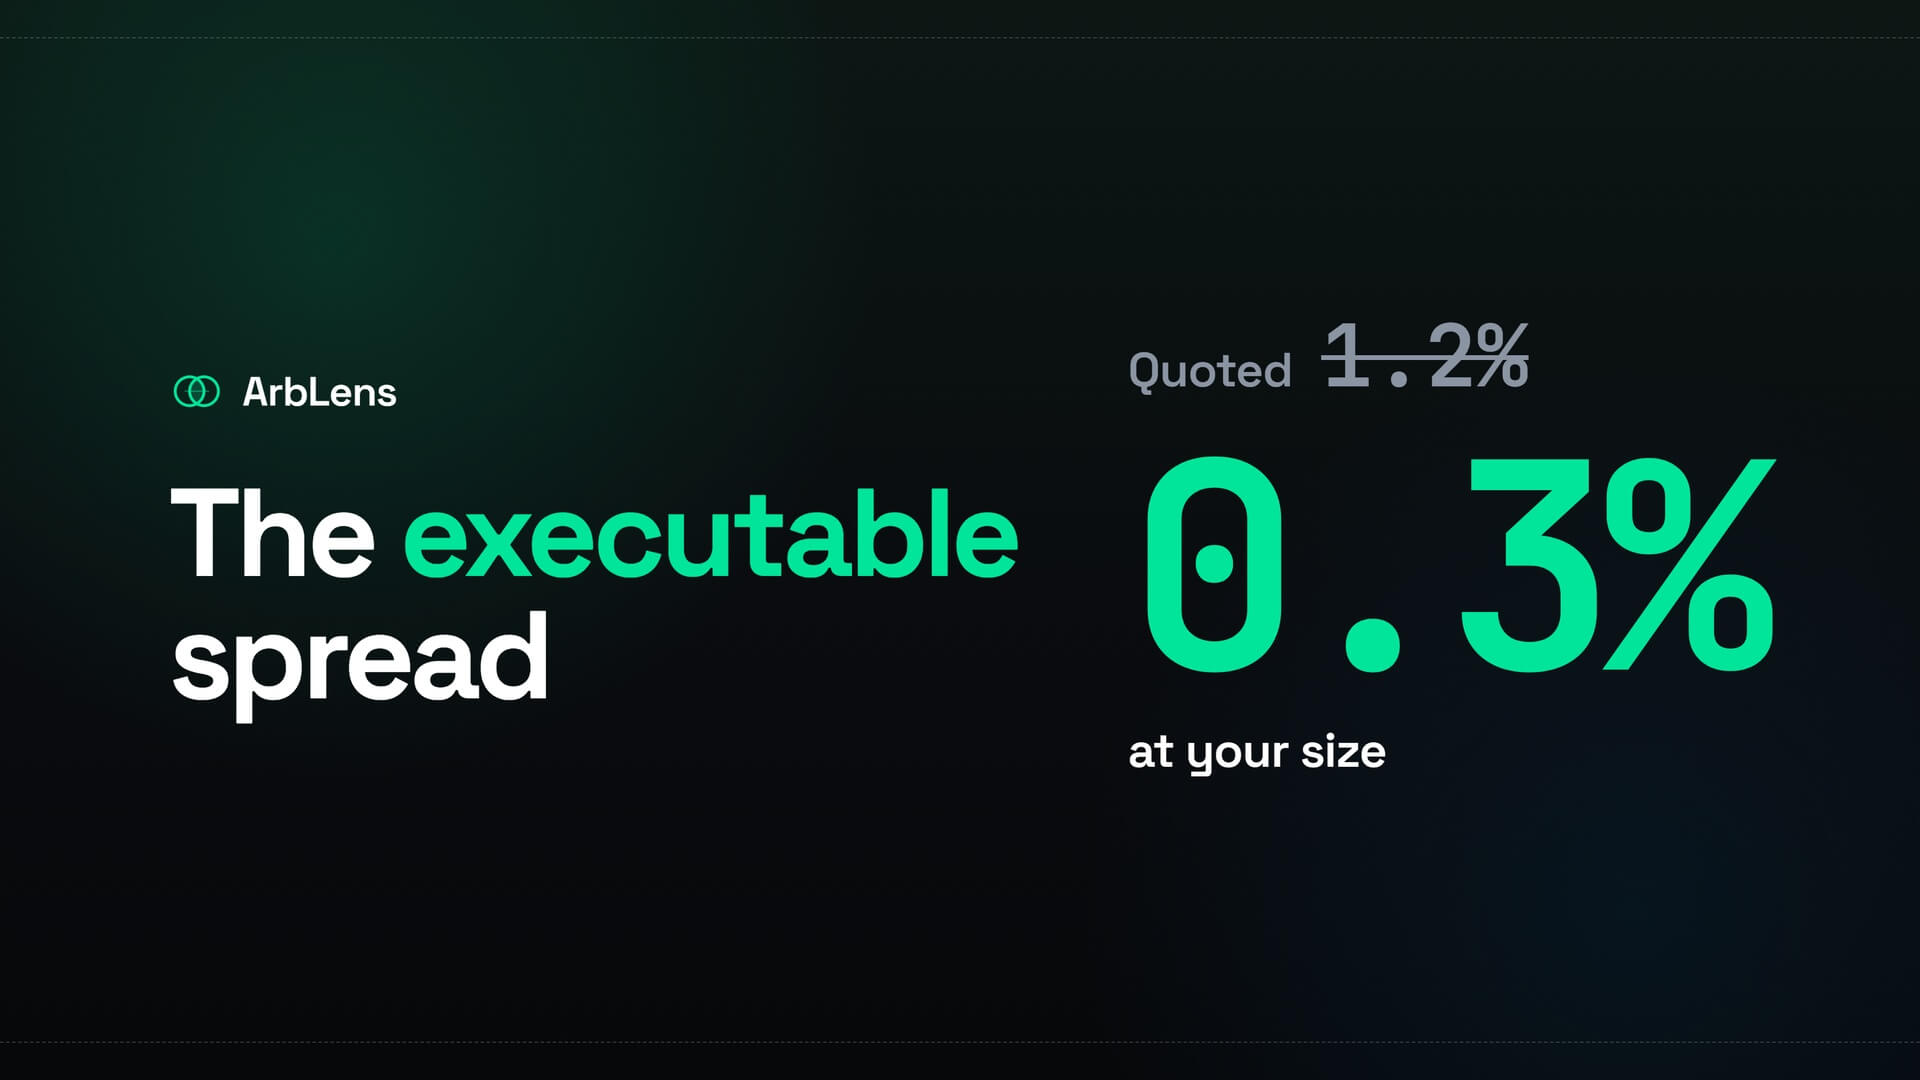
A visible spread is not the same as an executable trade.
The quoted prices may cover only a few tokens. One venue may show stale data, or the products may have different issuers and settlement terms. Before estimating profit, check what can actually be bought and sold at your intended size.
Start with the correct prices
A scanner may calculate the spread from last traded prices. That can be misleading.
For an arbitrage trade, the relevant prices are:
The lowest executable ask on the venue where you will buy
The highest executable bid on the venue where you will sell
The gross spread is:
$$\text{Gross spread} = \frac{\text{Sell bid} - \text{Buy ask}}{\text{Buy ask}} \times 100\%$$
If the last trade occurred at a better price than the current order book offers, that price is no longer available.
Check the timestamp too. Tokenized-equity markets can trade slowly, so the last price may be minutes or hours old.
Confirm that the products match
Two products using the same stock ticker may not be equivalent.
One may be a transferable, share-backed token. The other may be a synthetic contract, brokered share, or perpetual future. Their prices can diverge because their rights, issuers, and settlement rules differ.
Before treating the gap as arbitrage, compare:
Issuer and custodian
Token contract
Backing or collateral
Trading schedule
Redemption rights
Dividend treatment
Transfer support
If the products cannot be transferred, redeemed, or hedged against each other, the trade depends on eventual price convergence. That is basis trading, not locked spot arbitrage.
What 24-hour volume tells you
Twenty-four-hour volume shows how much trading activity the market reported over the previous day.
It is useful as a first filter. A market with very little activity is more likely to have stale prices, wide bid-ask spreads, and thin books.
Volume does not show how much liquidity is available now.
A pair can report $200,000 in daily volume and still have almost no orders near the current price. Most of that activity may have occurred earlier or in a few large trades.
The opposite is possible too. A market with modest daily volume may have a market maker quoting usable depth on both sides.
Volume thresholds are only filters
Fixed thresholds such as "$50,000 is tradable" or "$200,000 is comfortable" are too broad to use as position-sizing rules.
A $500 order may be reasonable in one market with $50,000 of daily volume and impossible in another. It depends on the current book.
Markets below $10,000 in reported daily volume deserve extra caution. Prices may be stale, and exiting the position can be difficult. That still does not mean every market above $10,000 is safe.
Use volume to remove obviously inactive pairs. Use order-book depth to decide how much can be traded.
Order-book depth sets the real trade size
The best bid and ask show only the first price level.
Suppose the sell venue displays a high bid, but that bid covers only a handful of tokens. A larger order will consume lower bids, reducing the average sale price. The same problem applies to the buy side: the order may move through several asks.
This is slippage.
Calculate the volume-weighted average price for the full order on both exchanges. Then recalculate the spread from those average prices.
$$\text{Executable spread} = \frac{\text{Average sell price} - \text{Average buy price}}{\text{Average buy price}} \times 100\%$$
The shallower side limits the trade. Deep liquidity on the buy venue does not help if the sell venue cannot absorb the same amount.
Check both entry and exit liquidity
A market may have enough depth to open the position but not enough to close it later.
This matters when the trade is not a direct transfer arbitrage. If you buy one product and short another, both positions eventually need to be unwound through their respective order books.
Look at:
Depth near the current bid and ask
Gaps between price levels
Size available within your slippage limit
Recent trade frequency
Liquidity during the expected exit session
The underlying stock’s liquidity does not guarantee liquidity in its tokenized version.
Apple, Tesla, and Nvidia shares trade actively in traditional markets. A particular token linked to one of those stocks may still have a thin order book on a crypto venue.
Trading fees apply to both legs
Each exchange charges its own maker and taker fees. Tokenized-equity products may use a different fee schedule from regular crypto spot markets.
Do not assume a universal 0.05–0.1% rate. Check the fee tier and product page for both venues.
A complete trade may involve four charged orders:
Buy on the cheaper venue
Sell on the more expensive venue
Restore inventory on the first venue
Restore inventory on the second venue
If the token can be transferred, rebalancing may use a withdrawal instead of two extra trades. That introduces withdrawal fees, network costs, and transfer delays.
Use the cheaper valid route, not the route with the fewest visible steps.
Market hours affect the data
Tokenized-equity products may continue trading while the underlying stock market is closed.
During those hours, there is no live primary-market price to anchor the token. Books may become thinner, and different venues may price overnight news differently.
A wide weekend spread may narrow when the underlying market reopens. It may also reflect a genuine change in the expected opening price.
Check whether both tokenized markets are open on the same schedule and whether their reference prices are updating.
Calculate net profit at your size
The useful number is not the displayed spread. It is the expected result after every cost:
$$\begin{aligned} \text{Net PnL} ={}& \text{Sale proceeds} - \text{Purchase cost} \\ &- \text{Trading fees} - \text{Slippage} \\ &- \text{Transfer costs} - \text{Borrowing or funding costs} \end{aligned}$$
If the products are not directly interchangeable, include the possible loss from the basis widening before exit.
Start with a small order. Compare the expected fill with the actual execution, then check whether the second leg can be closed at the quoted price. That test provides more useful information than the market’s 24-hour volume alone.