APR and ROI: calculating the real return on funding arbitrage
Headline funding rates overstate what a trade earns. Learn how to calculate ROI and APR using both legs, trading costs, slippage, and margin reserves.
Part 4 of a four-part series on futures arbitrage.
A funding-rate difference shows the potential income from a position. It doesn't show what the trade will earn after fees, slippage, margin requirements, and changes in the rate.
Annualizing the headline funding rate is easy. Calculating the return on the capital actually tied up in both legs takes more work.
APR and APY are not the same
APR is a simple annualized rate. It projects the return from one period across a full year without assuming that profits are reinvested.
APY includes compounding. It assumes each payment is added to the position and earns the same return in later periods.
For an eight-hour funding interval, there are:
$$3 \times 365 = 1{,}095$$
funding periods in a year.
If the net return is measured correctly for one eight-hour period, simple APR can be calculated as:
$$\text{APR} = \text{Period ROI} \times 1{,}095$$
The difficult part is calculating period ROI. The funding rate alone isn't enough.
The headline calculation
Suppose the funding-rate difference between two exchanges is 0.06% per eight-hour period.
Annualizing that number gives:
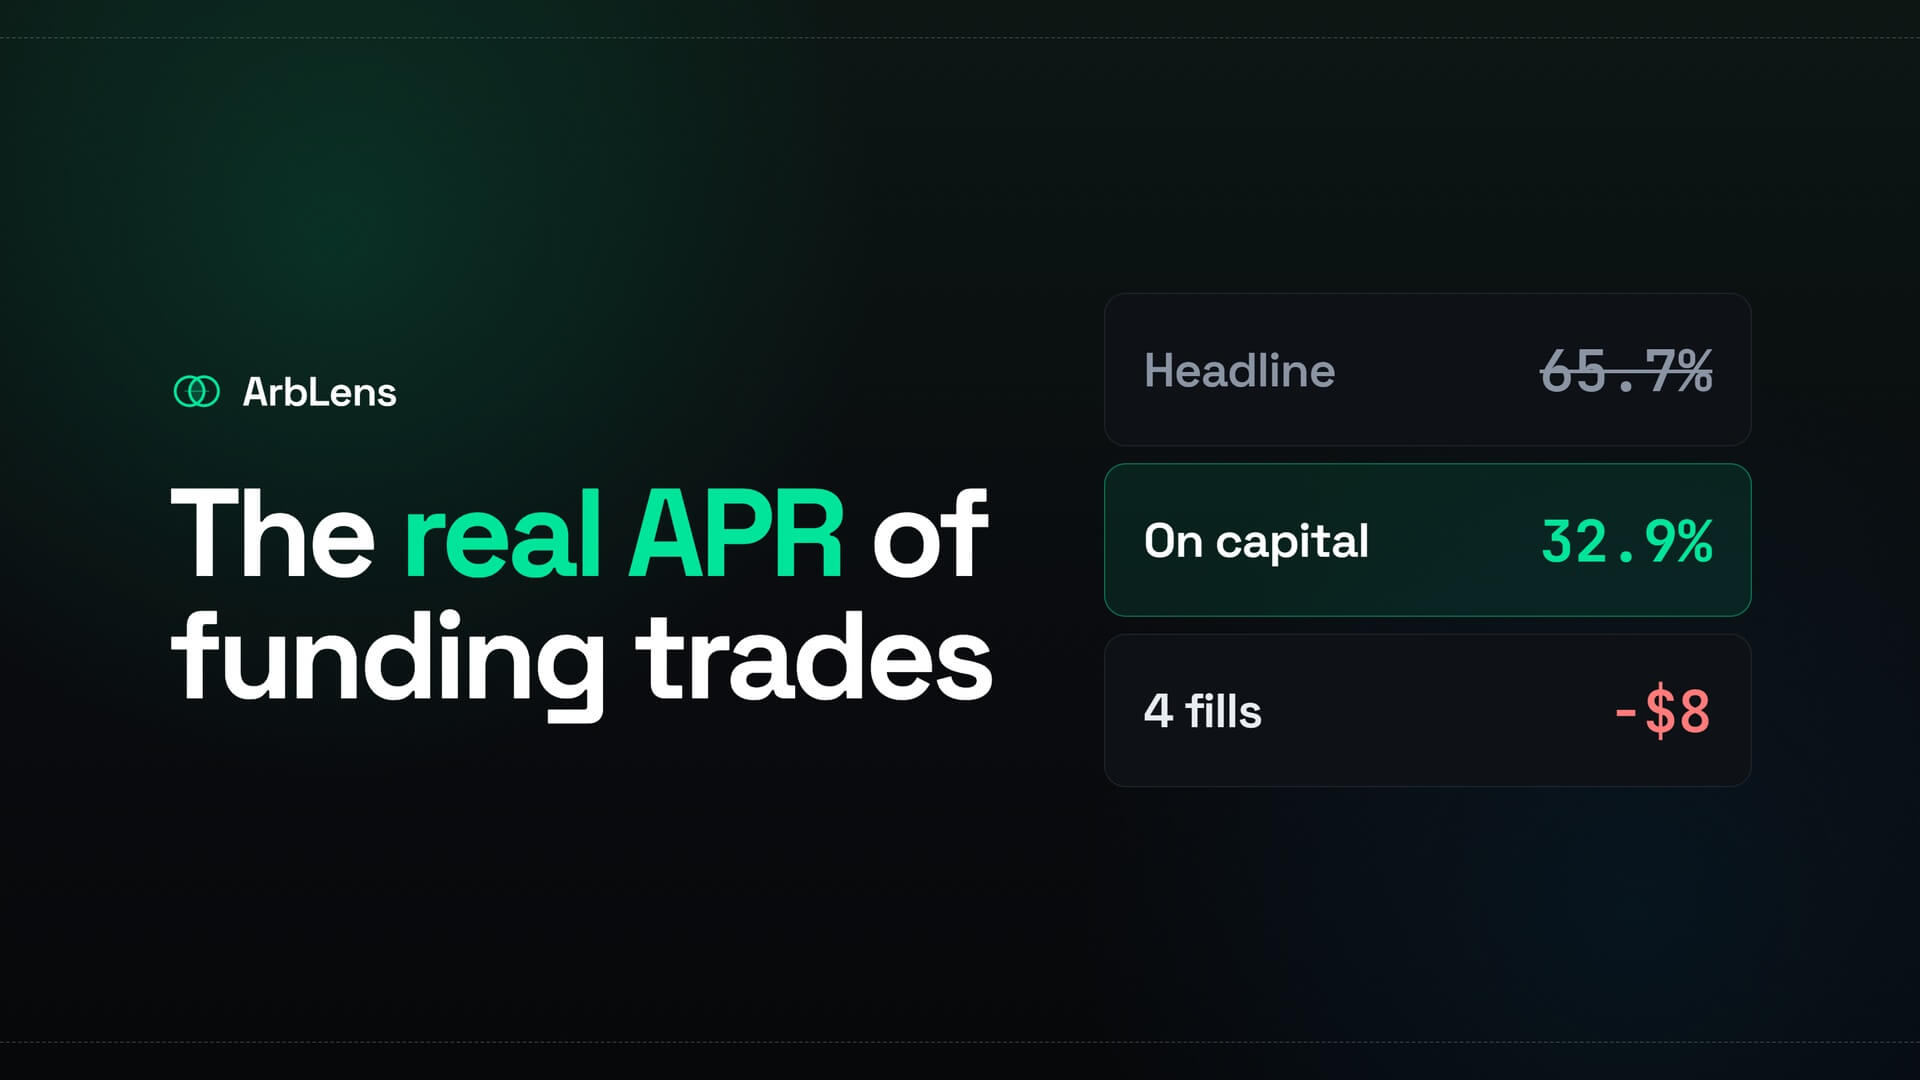
$$0.06\% \times 1{,}095 = 65.7\%$$
That 65.7% is the annualized funding rate on the matched position notional. It assumes the same rate remains available for every period of the year.
It is not automatically the APR on the trader's total capital.
Count the capital on both exchanges
Assume you keep $5,000 on Binance and another $5,000 on Bybit.
If each leg has a notional value of $5,000, a combined funding rate of 0.06% produces:
$$\$5{,}000 \times 0.06\% = \$3$$
The trade earns $3 gross for that period. It does not earn 0.06% on the full $10,000 committed across both venues.
The period return on capital is:
$$\frac{\$3}{\$10{,}000} \times 100\% = 0.03\%$$
Annualized:
$$0.03\% \times 1{,}095 = 32.85\%$$
The difference is substantial. The 65.7% figure uses one leg's notional as the denominator. The 32.85% figure uses the capital held on both exchanges.
Any additional liquidation reserve lowers the capital return further.
Calculate ROI before annualizing
ROI measures the net result against the total capital committed to the trade:
$$\text{ROI} = \frac{\text{Net PnL}}{\text{Total committed capital}} \times 100\%$$
For a cross-exchange funding trade, committed capital includes:
Margin posted for the long
Margin posted for the short
Capital reserved to avoid liquidation
Any balance kept idle for rebalancing
Use the same definition for every strategy you compare. Otherwise, one trade may be measured against position notional while another is measured against actual collateral.
That produces attractive numbers, not useful ones.
Start with net PnL
A practical funding PnL calculation is:
$$\begin{aligned} \text{Net PnL} ={}& \text{Funding received} - \text{Funding paid} \\ &+ \text{Basis PnL} - \text{Trading fees} \\ &- \text{Slippage} - \text{Transfer and borrowing costs} \end{aligned}$$
Basis PnL matters because the long and short contracts may move relative to each other. A position can collect funding and still lose money if the cross-exchange basis widens before exit.
Four fills may be charged
Opening and closing a two-leg trade can require four orders:
Open the long
Open the short
Close the long
Close the short
Suppose each fill is charged a hypothetical 0.04% taker fee and each leg has $5,000 of notional value.
Each order costs $2, so the four fills cost $8 in total. The funding example above earns $3 gross per period. It therefore needs almost three unchanged funding periods just to recover the trading fees.
Slippage extends that break-even point.
Actual maker and taker fees depend on the exchange, account tier, and order type. Use the rates shown on your own accounts rather than a generic fee table.
Spread and slippage affect both entry and exit
Funding is only one part of the trade. The two contracts may already trade at different prices when the positions are opened.
That entry basis can help or hurt. The result depends on where the contracts trade when both legs are closed.
Use expected average fill prices rather than the best bid and ask. On a thin contract, the visible top price may cover only a small order. The rest of the position fills deeper in the book.
Run the same depth check for the exit. A trade that looks profitable at the mark price may be expensive to close.
Opportunity cost belongs in the comparison
Margin held on two exchanges cannot be used elsewhere at the same time. That is an opportunity cost, not a fee deducted by the exchange.
It is still relevant.
A strategy earning 12% net APR with low turnover and manageable risk may be preferable to one advertising 40% while requiring constant rebalancing, high leverage, and exposure to weaker venues.
Capital efficiency should be compared with the operational work and risk needed to achieve it.
Leverage changes the denominator and the risk
Funding is generally calculated from position notional, not the margin posted.
Using leverage can therefore raise the apparent APR on collateral. A $5,000 position backed by $1,000 of margin receives funding on the $5,000 notional.
The same leverage reduces the room before liquidation.
The shortcut that 5x leverage means liquidation after exactly a 20% adverse move is unreliable. Maintenance margin, fees, mark-price rules, account mode, and added collateral all affect the actual liquidation level.
In a cross-exchange hedge, one leg can approach liquidation while the other shows an offsetting gain. The exchanges do not share collateral.
Funding projections decay quickly
A 65.7% annualized rate does not mean the trade will earn 65.7% over the next year. It means one short period has been multiplied by 1,095.
Funding can change before the next settlement. Other traders may enter the same trade and compress the rate. One side may reverse sign.
Alongside APR, record:
The actual holding period
Funding received and paid
Total fees
Basis PnL
Maximum margin used
Net return on all committed capital
That history shows whether the strategy works outside a single attractive screenshot.
There is no universal minimum APR
Rejecting every trade below 15–20% APR is not a sound rule. A lower return may come from deeper markets and more stable rates. A higher projected APR may disappear after one funding period or carry much more liquidation risk.
Compare net APR, not the headline rate. Then compare the liquidity, expected duration, venue exposure, and capital reserve behind it.
ArbLens tracks paired positions across supported exchanges and combines funding, fees, slippage, and both legs' PnL into a net result. It does not predict future funding rates. It provides the realized numbers needed to check whether the projected APR survived contact with the actual trade.